Merchant-Initiated Fraud Detection (MIF)
This document provides a detailed overview of how Fraudio's Merchant-Initiated Fraud (MIF) Detection product works. It is intended for technical and risk teams who want to understand the underlying detection logic beyond the API layer.
Fraudio's MIF product leverages machine learning techniques to identify sequences of transactions that indicate fraudulent merchant behaviour. When the system determines that a merchant is likely to be fraudulent, it generates a fraud report containing the supporting evidence and risk rationale.
Reported Entity
The Merchant-Initiated Fraud product evaluates and reports on merchants. All fraud reports generated by this product are associated with a specific merchant entity, and the detection logic analyses sequences of transactions to identify fraudulent merchant behaviour patterns.
Scope & Coverage
Fraud Types Detected
Fraudio’s MIF solution is primarily designed to detect merchant bust-out fraud — a scheme in which fraudsters control one or more merchant accounts to process transactions with stolen or unauthorised payment cards.
Typical bust-out scenarios include:
- Fraudsters initially process legitimate transactions to establish trust with an acquiring bank or payment processor.
- Once a positive history is built, they rapidly increase volumes of fraudulent transactions using stolen or counterfeit card data.
- The fraudster disappears after chargebacks and fraud notifications start arriving, leaving losses with the acquirer or processor.
While bust-out fraud is the primary target, the system also detects other merchant-initiated fraud behaviours due to their similar patterns:
- Identity Swap – Using a third party’s identity to obtain merchant accounts.
- Business Remodelling – Misrepresenting business type or risk category, then pivoting to prohibited or high-risk goods/services.
- Transaction Laundering – Processing illicit transactions through another business’s legitimate merchant credentials.
- Money Laundering – When it manifests through bust-out-like behaviour such as rapid cash-out of illicit funds. (Note: for comprehensive monitoring of money-laundering activity, Fraudio provides a dedicated AML product)
For a conceptual overview of the fraud types that this product covers, see the MIF Interview on Fraudio's website.
Limitations
The MIF product is not intended to cover:
- Fraud scenarios outside the documented pattern categories – The MIF product only focuses on the behaviours listed in the Merchant Fraud Scenarios overview below.
- Patterns that cannot be triggered due to missing or incomplete data – Certain models depend on specific inputs. For example, refund-based patterns require reliable refund indicators; if these fields are missing or inaccurate, those alerts will not fire.
- Cases where systemic data quality issues redefine “normal” behaviour – If the incoming transaction data is heavily delayed, incorrect, or inconsistent (e.g., MCCs misclassified, volumes duplicated, timestamps inaccurate, wrong currency), the models will learn and baseline against this distorted data. In such cases, the system may fail to identify anomalies because the faulty data has effectively become the “normal” reference.
If your risk appetite or fraud concerns extend beyond the current scope, Fraudio can work with you to evaluate and expand coverage.
Behavioural & Statistical Patterns
Fraudio detects behavioural patterns typically associated with merchant bust-out fraud, where a merchant's transactional activity deviates from what is normal for that merchant or for similar merchants in the global network.
Defining "Normal" Behaviour
Fraudio builds a behavioural baseline using the global merchant dataset:
- Self-comparison: recent transaction sequences are compared with a merchant’s own historical data (days to months).
- Peer comparison: a merchant’s behaviour is benchmarked against similar peers across all Fraudio clients, using factors such as:
- Merchant Category Code (MCC)
- Country
- MCC + country combinations
- Cluster analysis (based on volume, average ticket value, KYC level, and other factors)
When an alert is raised, the report reason will indicate whether the anomaly is historical ("compared to the merchant's past"), peer-based ("compared to similar merchants") or both.
Outlier Definition
A transaction sequence is considered an outlier when one or more statistical features deviate significantly from the mean — typically by several standard deviations, with thresholds dynamically determined by machine learning models.
Example report reason:
Detected an outlying sequence of transactions with a high maximum capture amount compared to the merchant’s peer group.
It is important to note that not all outliers imply fraud. Fraud labels, domain knowledge, model calibration, and client feedback loops help the system focusing on combinations of outliers that historically signal fraudulent merchant behaviour.
Merchant Fraud Scenarios
Fraudio translates detected anomalies into comprehensive report reasons, each describing a type of transactional behaviour that deviates from what is normally expected. These report reasons can be grouped under different Merchant Fraud Scenarios to provide a higher-level understanding of the kinds of behaviours the system monitors and may flag as elevated risk.
| Scenario | Description | Key Indicators |
|---|---|---|
| Volume & Velocity Shifts | Monitors sudden growth in transaction count or value to achieve early detection of bust-out merchants that suddenly increase processing | • High number of high-risk authorisations • Sharp rise in total authorised/captured amount • Daily/weekly capture count spikes • Transactions occurring much faster than usual |
| Geographic Exposure & Location Shifts | Monitors merchants whose activity moves into new or riskier geographies to detect merchants expanding into unfamiliar markets that may signal mule operations | • Sudden rise in transactions from high-risk countries • Rapid shift from domestic to cross-border processing • Unusual currency mix changes |
| Payment Channel & Method Changes | Monitors shifts in how payments are processed to detect merchants moving to riskier, less secure channels | • Rising share of CNP, MOTO, or 3DS-disabled transactions • Increased use of magstripe or fallback transactions |
| Refund & Settlement Behaviour | Monitors merchant instability through refunds to flag refund fraud or cash-out schemes | • High ratio or total amount of refunds • Refunds exceeding captures (negative net balance) |
| Decline Patterns & Fraud Indicators | Monitors failed attempts and elevated risk signals to reveal card testing, mule networks, or compromised accounts | • Unusual ratio of failed authorisations • High share of suspected fraud response codes • High proportion of high-risk PFD scores |
| Timing Anomalies | Monitors when the merchant transacts to surface scripted attacks, card testing, or coordinated fraud runs | • Spike in overnight transactions • Sudden weekend/holiday processing • "Sleeping merchant" pattern |
| Repetition & Value Patterns | Monitors scripted or manipulated behaviour to highlight automation, testing, or staged bust-outs | • Many authorisations with same card(s)/amount • Sudden jump in maximum ticket size |
| Network & Relationship Risk | Monitors merchants connected to known high-risk entities to uncover organised fraud rings and shell networks | • Shared payment instruments across merchants • Overlapping device fingerprints/IPs • New merchants linked to flagged entities |
| Chargeback & Fraud Notification Spikes | Monitors abnormal dispute or fraud claim activity to surface merchants with escalating disputes before regulatory impact | • Rising chargeback ratio or count • Sudden surge in first chargebacks • Breaching scheme risk thresholds |
| Shopper Identity & Authentication Anomalies | Monitors suspicious behaviour in merchant identifiers to flag account farming, synthetic identity use, or fraudulent sign-ups | • Mismatched cardholder data • Disposable emails or high-velocity new accounts • High AVS/CVV failure rates |
| Device / IP Intelligence Gaps | Monitors merchants attracting unusual technical activity to identify organised fraud testing or bot-driven carding | • High percentage of anonymised IPs • One device for wide range of cards/BINs |
Each of these pattern types can be expressed as a report reason such as:
Detected an outlying sequence of high total amount of captures with a high diversity of countries, compared to the merchant's historical transactions.
Detected a sequence of transactions with a high ratio of refunds (above 50%) out of all captures.
Detected an outlying sequence of transactions with a high ratio of 3DS-disabled transactions compared to the merchant's peer group.
The system may combine several anomalous signals when generating a single alert, providing a transparent and traceable rationale for why the merchant's behaviour is assessed as elevated risk.
Technical Overview
Fraudio's MIF product transforms merchant activity from raw transaction streams into enriched behavioural merchant intervals, incorporating both historical and peer context. These enriched intervals serve as the foundation for the multi-stage modelling pipeline that identifies abnormal behavioural shifts and quantifies fraud risk.
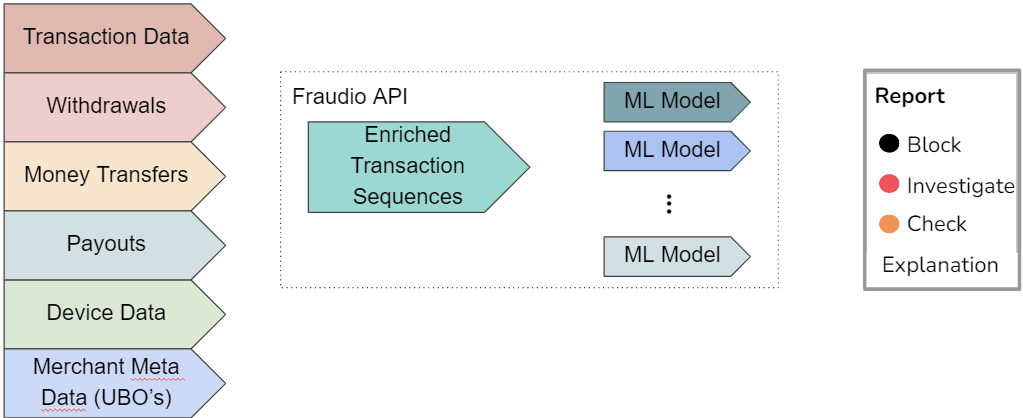
The flow illustrates how raw transaction data moves through Fraudio's detection stack — from ingestion and feature enrichment to model scoring, explanation generation, and delivery of actionable outputs.
- Data ingestion → transactions & metadata
- Feature enrichment → aggregates, embeddings, peer context
- Model matrix → unsupervised anomaly detection → supervised models → ensemble scoring
- Score consolidation → single fraud classification
- Explanation layer → report reason based on the most relevant risk factor
- API output → fraud report for operational review or automated decisioning
The detection process consists of two distinct stages: data enrichment (transforming raw data into meaningful features) and scoring (evaluating those features to determine fraud risk). These stages are described below.
Data & Feature Enrichment
Accurate detection of merchant-initiated fraud requires understanding how a merchant behaves over time, not just how individual transactions look in isolation. Therefore, Fraudio builds a comprehensive behavioural snapshot for each merchant at every detection interval. This creates a single, enriched data view that provides the context needed for effective fraud detection.
The enrichment process begins with a basic merchant interval profile derived from recent transactional data and merchant metadata:
{
    "interval_end": "2025-10-25T22:59:59Z",
    "merchantid": "29810",
    "merchantname": "Money Corporation",
    "mcccode": "7995",
    "merchantcountry": "GB",
    "kyc_level": "1",
    "registrationdate": "2020-08-01T14:19:21Z"
}
From this raw input, Fraudio progressively builds a richer view of behaviour by adding features derived from statistical aggregates, state models, peer relationships, network links, and other advanced techniques. After enrichment, the same merchant interval carries the merchant's complete behavioural context:
{
    "interval_end": "2025-10-25T22:59:59Z",
    "merchantid": "29810",
    "merchantname": "Money Corporation",
    "mcccode": "7995",
    "merchantcountry": "GB",
    "kyc_level": "1",
    "registrationdate": "2025-08-25T23:59:59Z",
    "merchant_1d_txn_count": 42,
    "merchant_7d_avg_txn_count": 31,
    "merchant_1d_txn_count_zscore": 2.04,
    "merchant_1d_refund_ratio": 0.08,
    "merchant_90d_avg_refund_ratio": 0.03,
    "merchant_1d_refund_ratio_zscore": 2.50,
    "mcccode_merchant_1d_refund_ratio_zscore": 8.94,
    "merchantcountry_merchant_1d_avg_refund_ratio_zscore": 1.11,
    "linked_merchants": 3,
    "shared_cards_with_flagged_merchants": 27
}
This creates a rich, multi-level feature matrix that forms the foundation for the subsequent scoring stages. The enrichment process applies various techniques to build this feature set:
- Historical Aggregates: Statistical summaries of merchant behavior over multiple time windows (1 day, 7 days, 30 days, 90 days, multi-year), with z-score normalization to identify deviations from expected patterns
- Peer Group Analysis: Comparison of merchant behavior against similar merchants across Fraudio's global network, using dynamically defined peer sets based on MCC, country, and behavioral characteristics
- Clustering: Unsupervised learning to identify merchants with similar behavioral characteristics for accurate peer comparisons
- Link Analysis: Graph-based detection of relationships between merchants, cards, devices, and other entities to identify coordinated fraud rings
- Additional Techniques: Hidden Markov Models (HMM) for detecting behavioral state transitions, representation learning for capturing complex sequential patterns, and time-series forecasting (LSTM) for identifying breaks in expected trends
For detailed explanations of these enrichment techniques, see the Techniques & Backend documentation.
Hybrid ML-Based Scoring
Once the merchant interval has been enriched with behavioral features, the scoring stage evaluates these features to determine fraud risk. Fraudio evaluates merchant transaction intervals using a suite of complementary models that operate simultaneously to provide comprehensive fraud detection.
The scoring process uses three main model types:
| Model Type | Purpose | Key Advantage |
|---|---|---|
| Unsupervised | Identify deviations from established behavioural norms | Detects new, unknown fraud patterns |
| Supervised | Leverage historical fraud labels to recognise known patterns | High accuracy on known fraud types |
| Ensemble | Integrate outputs from multiple approaches | Unified, robust fraud recommendation |
The outputs from these distinct approaches are integrated through an ensemble framework to produce a single, unified fraud recommendation.
Unsupervised Learning – Anomaly Detection
Unsupervised models identify deviations from established merchant behavioural norms without requiring prior fraud labels. Autoencoder-based anomaly detection compresses past transaction sequences into compact representations and flags merchants whose current behaviour cannot be accurately reconstructed, indicating potential fraud.
Supervised Learning
Supervised models leverage historical fraud labels to recognise known fraud patterns. Random Forest models—ensembles of decision trees—evaluate enriched features to identify high-risk patterns similar to previously confirmed fraud cases.
As the name implies, supervised learning requires labelled data — historical examples where merchant behaviour has been confirmed as fraudulent or legitimate. Because merchant evaluations are often subjective and depend on each organisation's specific risk tolerance and business context, your own merchant evaluations are essential for effective training. High-quality, consistent labelling ensures that the model learns patterns aligned with your definitions of fraud and produces reliable, context-appropriate results.
Ensemble Learning
No single modelling technique is optimal for every merchant type or fraud pattern. The ensemble layer integrates outputs from multiple specialized models, weighting each model's contribution according to its historical performance for that merchant segment. Different models are trained for distinct merchant segments (e.g., grouped by MCC category), and the ensemble adaptively combines their outputs to deliver a single, reliable fraud score.
For detailed explanations of these machine learning approaches, including how autoencoders, Random Forests, and ensemble methods work, see the Techniques & Backend documentation.
Model Explainability and Decision Transparency
The model architecture is designed to produce outputs that are both interpretable and auditable.
- After scoring, Fraudio analyses each decision to identify which input features and model components contributed most to the outcome.
- These contributions are ranked and expressed as domain-specific report reasons — concise, rule-like statements that summarise the most relevant behavioural factors (e.g., "Unusually high refund ratio compared to peers", "Volume spike compared to historical trend").
- When multiple signals contribute to a decision, the system highlights the most significant risk drivers while preserving the complete feature-level contribution data for audit and regulatory review.
Example
Internal: Gradient-boosted trees used
merchant_7d_refund_rate,peer_group_max_capture, and an LSTM-based trend-break feature.Output explanation: Detected an outlying sequence with unusually high refund ratio compared to peers and a sudden break in historical approval trend.
This explainability layer translates complex model reasoning into structured, interpretable outputs that closely resemble logical rules, while maintaining full traceability to the underlying model computations. This ensures that every detection can be clearly understood, reviewed, and validated.
For detailed information about model development lifecycle, governance, and compliance frameworks, see the Techniques & Backend documentation.