Techniques & Backend
This document provides a comprehensive overview of the technical techniques and backend systems that power Fraudio's fraud detection products. It explains the underlying detection logic, machine learning approaches, and data processing methods used across all Fraudio products.
Understanding these techniques will help you better understand how each product applies them to detect specific types of fraud and suspicious activity.
Product-Specific Applications
The techniques described in this document are used in different ways by each Fraudio product, depending on the specific fraud detection requirements:
Payment Fraud Detection (PFD): Operates in real time, evaluating individual transactions using aggregations and external data enrichment (BIN, IP, email, country data). Uses supervised learning with fraud-related chargeback and fraud notification labels, unsupervised anomaly detection, and ensemble methods to generate immediate fraud scores.
Merchant-Initiated Fraud Detection (MIF): Analyses sequences of transactions to detect fraudulent merchant behaviour. Applies historical aggregates, peer group analysis, clustering, and link analysis to merchant intervals. Uses unsupervised and supervised learning models, combined through ensemble methods, to identify bust-out fraud and other merchant fraud patterns.
Anti-Money Laundering (AML): Can evaluate any entity within transaction data (customers, merchants, transactions, accounts, networks). Uses behavioural analysis, statistical outlier detection, and AI-based pattern recognition. Applies unsupervised and supervised learning approaches to detect money laundering patterns, with rules-based detection for objective (mandatory) alerts.
Detection Architecture Overview
Fraudio's detection system transforms raw transaction data into actionable fraud insights through a multi-stage pipeline:
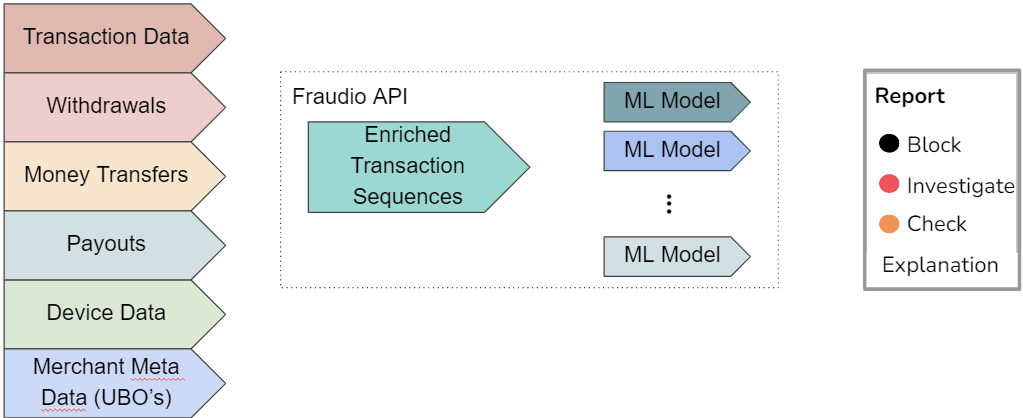
The flow illustrates how raw transaction data moves through Fraudio's detection stack — from ingestion and feature enrichment to model scoring, explanation generation, and delivery of actionable outputs.
- Data ingestion → transactions & metadata
- Feature enrichment → aggregates, embeddings, peer context
- Model matrix → unsupervised anomaly detection → supervised models → ensemble scoring
- Score consolidation → single fraud classification
- Explanation layer → report reason based on the most relevant risk factor
- API output → fraud report for operational review or automated decisioning
Data & Feature Enrichment
Accurate fraud detection requires understanding how entities (merchants, customers, transactions) behave over time, not just how individual transactions look in isolation. Therefore, Fraudio builds comprehensive behavioural snapshots for each entity at every detection interval. This creates a single, enriched data view that provides the context needed for effective fraud detection.
The enrichment process begins with a basic entity profile derived from recent transactional data and metadata. From this raw input, Fraudio progressively builds a richer view of behaviour by adding features derived from statistical aggregates, state models, peer relationships, network links, and other advanced techniques.
This creates a rich, multi-level feature matrix that forms the foundation for the subsequent modelling stages through techniques including statistical aggregation, state modelling, representation learning, forecasting, clustering, peer analysis, and link analysis — each contributing a complementary perspective on entity behaviour.
Historical Aggregates
Historical aggregation forms the core of Fraudio's behavioural enrichment and is the most critical foundation for detecting fraud. It captures how an entity's activity evolves over time and distinguishes natural fluctuations from abnormal behavioural shifts.
Time Windows & Statistical Measures
At every detection interval, Fraudio computes statistical aggregates over multiple rolling time windows:
- 1 day - Recent activity
- 7 days - Weekly patterns
- 30 days - Monthly patterns
- 90 days - Quarterly trends
- Multi-year - Long-term baselines (where data allows)
Across key entity dimensions (merchant, MCC, country, customer, etc.), it measures:
- Frequency - How often events occur
- Mean - Average values
- Standard deviation - Variability
- Skewness - Distribution shape
- Kurtosis - Distribution tail behavior
Z-Score Normalization
Each observation is normalised into a standard score (z-score), expressing how many standard deviations it deviates from its historical mean. This transformation allows consistent comparison across time and entities, adjusting for scale differences, seasonal patterns, and recurring cycles such as holidays, pay-day peaks, or weekend effects.
Because the z-score scales deviations by the entity's own historical variability, it naturally reflects how "normal" a peak is:
- Predictable patterns (e.g., Friday sales spikes) become part of expected variation
- Unexpected changes (e.g., sudden volume surges) produce high z-scores
- Seasonal businesses (e.g., travel merchants) adapt to their natural cycles
Example: A travel merchant with predictable seasonal summer peaks will not appear anomalous during its usual busy months, whereas a similar surge in winter, outside its established pattern, would yield a strong outlier signal.
This adaptive scaling helps alerts arise from genuine behavioural changes rather than from predictable, recurring patterns.
Peer Group Analysis
Whereas historical aggregates measure deviation from an entity's own past, peer group analysis evaluates deviation from comparable entities across Fraudio's global network.
At each detection interval, every entity is benchmarked against a dynamically defined peer set derived from clustering and historical aggregates (based on factors such as MCC, country, transaction profile, etc.). The entity's behavioural metrics are compared against the statistical distribution of those peers to determine whether its current activity falls within expected variation for that segment.
This provides external context for assessing risk. An entity may remain consistent with its historical baseline yet process significantly higher refund ratios or cross-border volumes than similar entities in the same region and category. In such cases, the peer-relative z-score highlights that the entity is operating outside normal peer behaviour, even if its own trend appears stable.
Peer benchmarking also helps mitigating seasonal or geographically driven effects. When market-wide fluctuations occur — for example, increased volumes during national holidays or regional sales events — the peer distribution adjusts accordingly.
Together, the historical baseline and peer analysis establish complementary behavioural references: the first quantifies internal deviations, the second external deviations. This dual perspective forms the contextual foundation for the subsequent modelling and risk-scoring stages.
Unsupervised Learning – Clustering
To support accurate peer group comparisons, Fraudio applies unsupervised clustering to identify entities with genuinely similar behavioural characteristics, moving beyond broad classifications such as MCC or country.
Clustering enables the system to build more precise peer groups by grouping entities based on multi-dimensional behavioural features — including transaction volume, average ticket value, approval rate, refund ratio, KYC level, and geographic footprint. This results in entity segments that reflect actual operational similarity rather than static categorical definitions.
Each cluster provides two complementary signals for subsequent analysis:
- Cluster-level statistics (e.g., mean refund ratio, approval rate, transaction velocity) that define expected behaviour within the group;
- Distance metrics that quantify how far an individual entity deviates from its cluster centre or whether its recent behaviour indicates a drift toward another cluster.
For example, a small e-commerce merchant that begins processing transactions similar in scale and risk profile to high-volume travel aggregators would move significantly away from its established cluster centroid, generating an anomaly signal for downstream models.
This clustering framework provides the structural basis for dynamic peer group definition, ensuring that comparisons and outlier detection reflect actual behavioural similarity rather than static business categorisation.
Link Analysis
Fraud often involves networks of interconnected entities. Detecting hidden relationships enables early identification of coordinated fraud schemes.
Fraudio builds a graph of linked identifiers such as cards, emails, IP addresses, device fingerprints, bank accounts, and terminal IDs. Graph algorithms then measure connectivity, detect communities of related entities, and identify central nodes that connect many suspicious entities.
For example, two seemingly unrelated merchants might share a large set of cards or devices, revealing an organised fraud ring. A new merchant with strong links to previously confirmed fraudulent accounts is scored as higher risk even before abnormal transaction behaviour emerges.
Hidden Markov Models (HMM)
Fraudsters often shift behaviour abruptly, moving from low, apparently safe activity to aggressive cash-out. Hidden Markov Models (HMMs) are used to detect these unlikely transitions.
An HMM assumes an entity operates in a small set of latent behavioural states such as steady trading, gradual growth, or high-risk cash-out. Each state has characteristic feature distributions — for instance, amount ranges, approval rates, refund ratios, or card origin mix. The model learns a transition matrix describing the probability of moving between states.
A legitimate entity might slowly increase ticket size over time. A fraudster could jump directly from low, stable amounts to very high amounts with many declines — a transition the HMM scores as highly improbable and flags as suspicious.
Representation Learning
Some behavioural shifts are too complex to express with simple statistics. Fraudio applies representation learning to capture these hidden, high-dimensional patterns directly from transaction sequences.
Specifically, Contrastive Predictive Coding (CPC) is applied: an unsupervised technique that predicts future steps in a sequence and learns a latent context vector summarising entity behaviour. This embedding captures complex sequential dynamics beyond simple aggregates or explicit state models.
If an entity's card-origin mix or transaction rhythm begins to drift in ways not explicitly modelled, the CPC representation shifts, allowing downstream models to react without requiring manual feature redesign.
Forecasting – Time Series Analysis
Fraud frequently appears as a break in expected trends — sudden volume growth, changing approval rates, or refund spikes. Time-series forecasting helps detect these early.
Each entity's transactions are modelled as a temporal sequence. Fraudio applies Long Short-Term Memory (LSTM) neural networks to forecast expected metrics such as transaction volume, approval rate, or refund share. Actual observations are compared to these forecasts to identify significant deviations.
If an entity predicted to grow gradually suddenly triples daily sales or sees approval rates collapse, the LSTM flags the behaviour as an unexpected break, providing an early warning signal.
Machine Learning Approaches
Fraudio employs a combination of unsupervised, semi-unsupervised, and supervised learning approaches for fraud detection. The choice of approach depends on the availability of labels, the nature of the fraud pattern, and the specific product requirements.
Unsupervised Learning
Unsupervised learning is particularly valuable for fraud detection because there are few labels available—most transactions are legitimate, and confirmed fraud cases represent only a small fraction of the total transaction volume. These models operate on unlabeled transaction data to identify anomalous patterns that deviate from expected behaviour.
Anomaly Detection
Fraud patterns evolve quickly, while reliable labels such as chargebacks may take weeks to appear. Relying only on historically labelled data risks overlooking new or fast-emerging schemes.
Fraudio addresses this with autoencoder-based anomaly detection. An autoencoder is a neural network trained to capture the normal behaviour of entities by compressing past transaction sequences into a compact internal representation and then reconstructing them. When a new behaviour cannot be reconstructed well, the reconstruction error increases. A high error indicates that the observed activity deviates from the established norm and is flagged as potentially anomalous. Because this method is not dependent on prior fraud labels, it can detect outliers and new patterns as soon as they arise.
Example: A long-established merchant suddenly begins processing large cross-border card payments would produce a high reconstruction error and be surfaced early for review, even if no similar case has previously been labelled as fraud.
Scenario: A small e-commerce merchant (typically processing $5K-10K monthly) suddenly begins processing $50K+ in cross-border transactions
Key Features: High z-score (3.2), high recent historical sum, ecommerce
Detection: Autoencoder reconstruction error spikes from 0.15 to 0.85 (normal range: 0.1-0.3) because the model cannot accurately reconstruct the new, unprecedented transaction patterns that deviate significantly from the entity's learned behavioral baseline
Result: Entity flagged for review
While the input data is unlabeled, the models are trained and configured to focus on patterns specifically associated with fraudulent activity. This approach enables detection of suspicious activity without requiring extensive historical labels.
Supervised Learning
Historical fraud cases provide essential signals about fraudulent behaviour. Fraudio leverages these labelled examples to train tree-based machine learning models, capable of recognising similar high-risk patterns in new entity activity.
At the core of this approach are Random Forests — ensembles of hundreds or even thousands of individual decision trees.
Each tree is built from a series of branching decisions, where every split considers a specific feature or threshold — for example, refund rate, average ticket size, or approval ratio.
The depth of a tree determines how many of these sequential conditions are applied, allowing the model to capture complex, multi-factor relationships within the data.
While a single tree might represent a limited view of risk, a Random Forest combines the outputs of many deep trees, each trained on slightly different data samples and feature subsets.
This structure allows the model to evaluate an enormous number of parameter combinations and interactions — far beyond what could realistically be analysed by a human or encoded in manual rules.
Each tree contributes a "vote" to the final outcome, and the aggregated result provides a robust, data-driven decision on fraud likelihood.
An additional advantage is explainability: by analysing how features contribute across all trees, Fraudio derives feature importance scores and translates them into clear report reasons.
Supervised models leverage historical labels and case outcomes to recognise known fraud patterns. These models are trained on confirmed cases where fraudulent activity has been verified, enabling them to identify similar patterns in new transactions. Given the sparsity of fraud labels, supervised learning is most effective when combined with unsupervised techniques: supervised models can identify patterns similar to known cases, while unsupervised methods handle the vast unlabeled space where new schemes may emerge.
As the name implies, supervised learning requires labelled data — historical examples where entity behaviour has been confirmed as fraudulent or legitimate. Because fraud evaluations are often subjective and depend on each organisation's specific risk tolerance and business context, your own fraud evaluations are essential for effective training. High-quality, consistent labelling ensures that the model learns patterns aligned with your definitions of fraud and produces reliable, context-appropriate results.
Ensemble Learning
No single modelling technique is optimal for every entity type or fraud pattern. To achieve a robust and adaptable fraud score, Fraudio combines multiple specialised models.
Different models are trained for distinct entity segments — for example, grouped by MCC category or transaction profile. An ensemble layer then integrates their outputs, weighting each model's contribution according to its historical performance for that segment. The result is a single fraud probability that balances the strengths of anomaly detection, deep learning, and tree-based approaches.
For a small e-commerce merchant, the ensemble may rely more on unsupervised anomaly signals and peer-group deviations, while for a high-volume travel merchant it may give greater weight to supervised models. This adaptive combination delivers a single, reliable score that remains effective across diverse fraud scenarios.
The combination of these approaches provides comprehensive coverage: unsupervised learning detects novel schemes and supervised learning leverages known patterns for high-confidence alerts.
Model Explainability and Decision Transparency
The model architecture is designed to produce outputs that are both interpretable and auditable.
- After scoring, Fraudio analyses each decision to identify which input features and model components contributed most to the outcome.
- These contributions are ranked and expressed as domain-specific report reasons — concise, rule-like statements that summarise the most relevant behavioural factors (e.g., "Unusually high refund ratio compared to peers", "Volume spike compared to historical trend").
- When multiple signals contribute to a decision, the system highlights the most significant risk drivers while preserving the complete feature-level contribution data for audit and regulatory review.
Example
Internal: Gradient-boosted trees used
merchant_7d_refund_rate,peer_group_max_capture, and an LSTM-based trend-break feature.Output explanation: Detected an outlying sequence with unusually high refund ratio compared to peers and a sudden break in historical approval trend.
This explainability layer translates complex model reasoning into structured, interpretable outputs that closely resemble logical rules, while maintaining full traceability to the underlying model computations. This ensures that every detection can be clearly understood, reviewed, and validated.
Model Development and Iteration Lifecycle
Fraudio's detection capability is designed as an adaptive system that evolves through structured improvement cycles.
Each iteration integrates new data, operational outcomes, and analyst feedback to maintain model relevance, accuracy, and alignment with emerging fraud patterns.
| Stage | Purpose and Key Activities |
|---|---|
| Baseline Controls | A validated configuration of rules and models is deployed to production, establishing the reference performance metrics for detection coverage, precision, and operational efficiency. |
| Observation and Feedback | The system operates in production under controlled monitoring. Alert outputs are reviewed by analysts and clients to assess accuracy, workload impact, and practical relevance. Observations from this stage inform areas for refinement. |
| Scenario Expansion | Insights from production feedback and new behavioural data are incorporated into the detection framework. This may include new anomaly dimensions, adjusted thresholds, or the introduction of additional feature sets to extend coverage. |
| Retraining and Calibration | Models are retrained or recalibrated using newly labelled cases and updated baselines. Parameters and thresholds are optimised to improve precision–recall balance and ensure alignment with client risk appetite. |
| Validation and Backtesting | Updated models and configurations are tested against both historical and current datasets to confirm performance stability and incremental improvement prior to redeployment. |
| Continuous Improvement | Once validated, the new configuration becomes the updated baseline. The process repeats at defined intervals, ensuring sustained effectiveness as data characteristics, entity profiles, and fraud patterns evolve. |
Structured iteration supports:
- Adaptability – models and rules are updated to reflect newly observed behaviours.
- Consistency – detection thresholds and alert logic remain aligned with current operational data.
- Reliability – performance is verified through regular backtesting and feedback review.
Each cycle establishes a new baseline that incorporates the most recent data and observations, keeping detection accurate and stable over time.
Rules-Based Detection
In addition to machine learning approaches, Fraudio offers a wide range of customizable rules that can be tailored for different operational needs. Rules are particularly suitable for scenarios that require clear-cut thresholds and binary triggers based on regulatory requirements or business logic.
Depending on the type of rule, they can be configured to generate reports in a non-realtime format or set up for real-time transaction monitoring and reporting.
You can use robust industry statistics to pinpoint transaction anomalies. Examples are the average transaction value in the gambling industry, or the standard deviation of amounts in Malta.
For an overview on how to set rules, please visit: Fraudio's Rules User Guide
Model Governance & Compliance
Fraudio's detection systems are operated under a formal governance framework to ensure reliability, transparency, and regulatory compliance.
Data Quality & Input Controls
- Continuous monitoring of feed completeness and timeliness (e.g., refunds, MCCs, device data).
- Automated validation rules detect missing or inconsistent fields; safe defaults or fallbacks are applied when possible (e.g., coalescing lower-frequency aggregates).
- Ingestion errors and data drift are logged.
Model Lifecycle Management
- Models are retrained or recalibrated on a defined schedule and when significant data or fraud pattern drift is detected.
- Post-deployment monitoring tracks stability, false positives/negatives, and key population metrics.
Threshold & Risk Appetite Calibration
- Detection thresholds are initially set using historical data and adjusted over time based on client risk appetite (e.g., conservative vs balanced modes).
- Safeguards ensure extreme threshold changes are reviewed before going live.
Auditability & Decision Traceability
- Every scored transaction sequence is logged with the model version, features, derived aggregates, and reason codes at decision time.
- This audit trail allows regulators or clients to reproduce any past decision, even if models have since evolved.
Human Oversight & Reporting
- Alerts flow into case management where trained analysts can review, annotate, and escalate.
- All overrides and dismissals are logged with user, timestamp, and reason.
- Upon development request, we can work together to have outputs support regulatory reporting (e.g., SAR/STR filing, Visa/Mastercard fraud and chargeback programs).